1. Select a discrete app icon.

notes
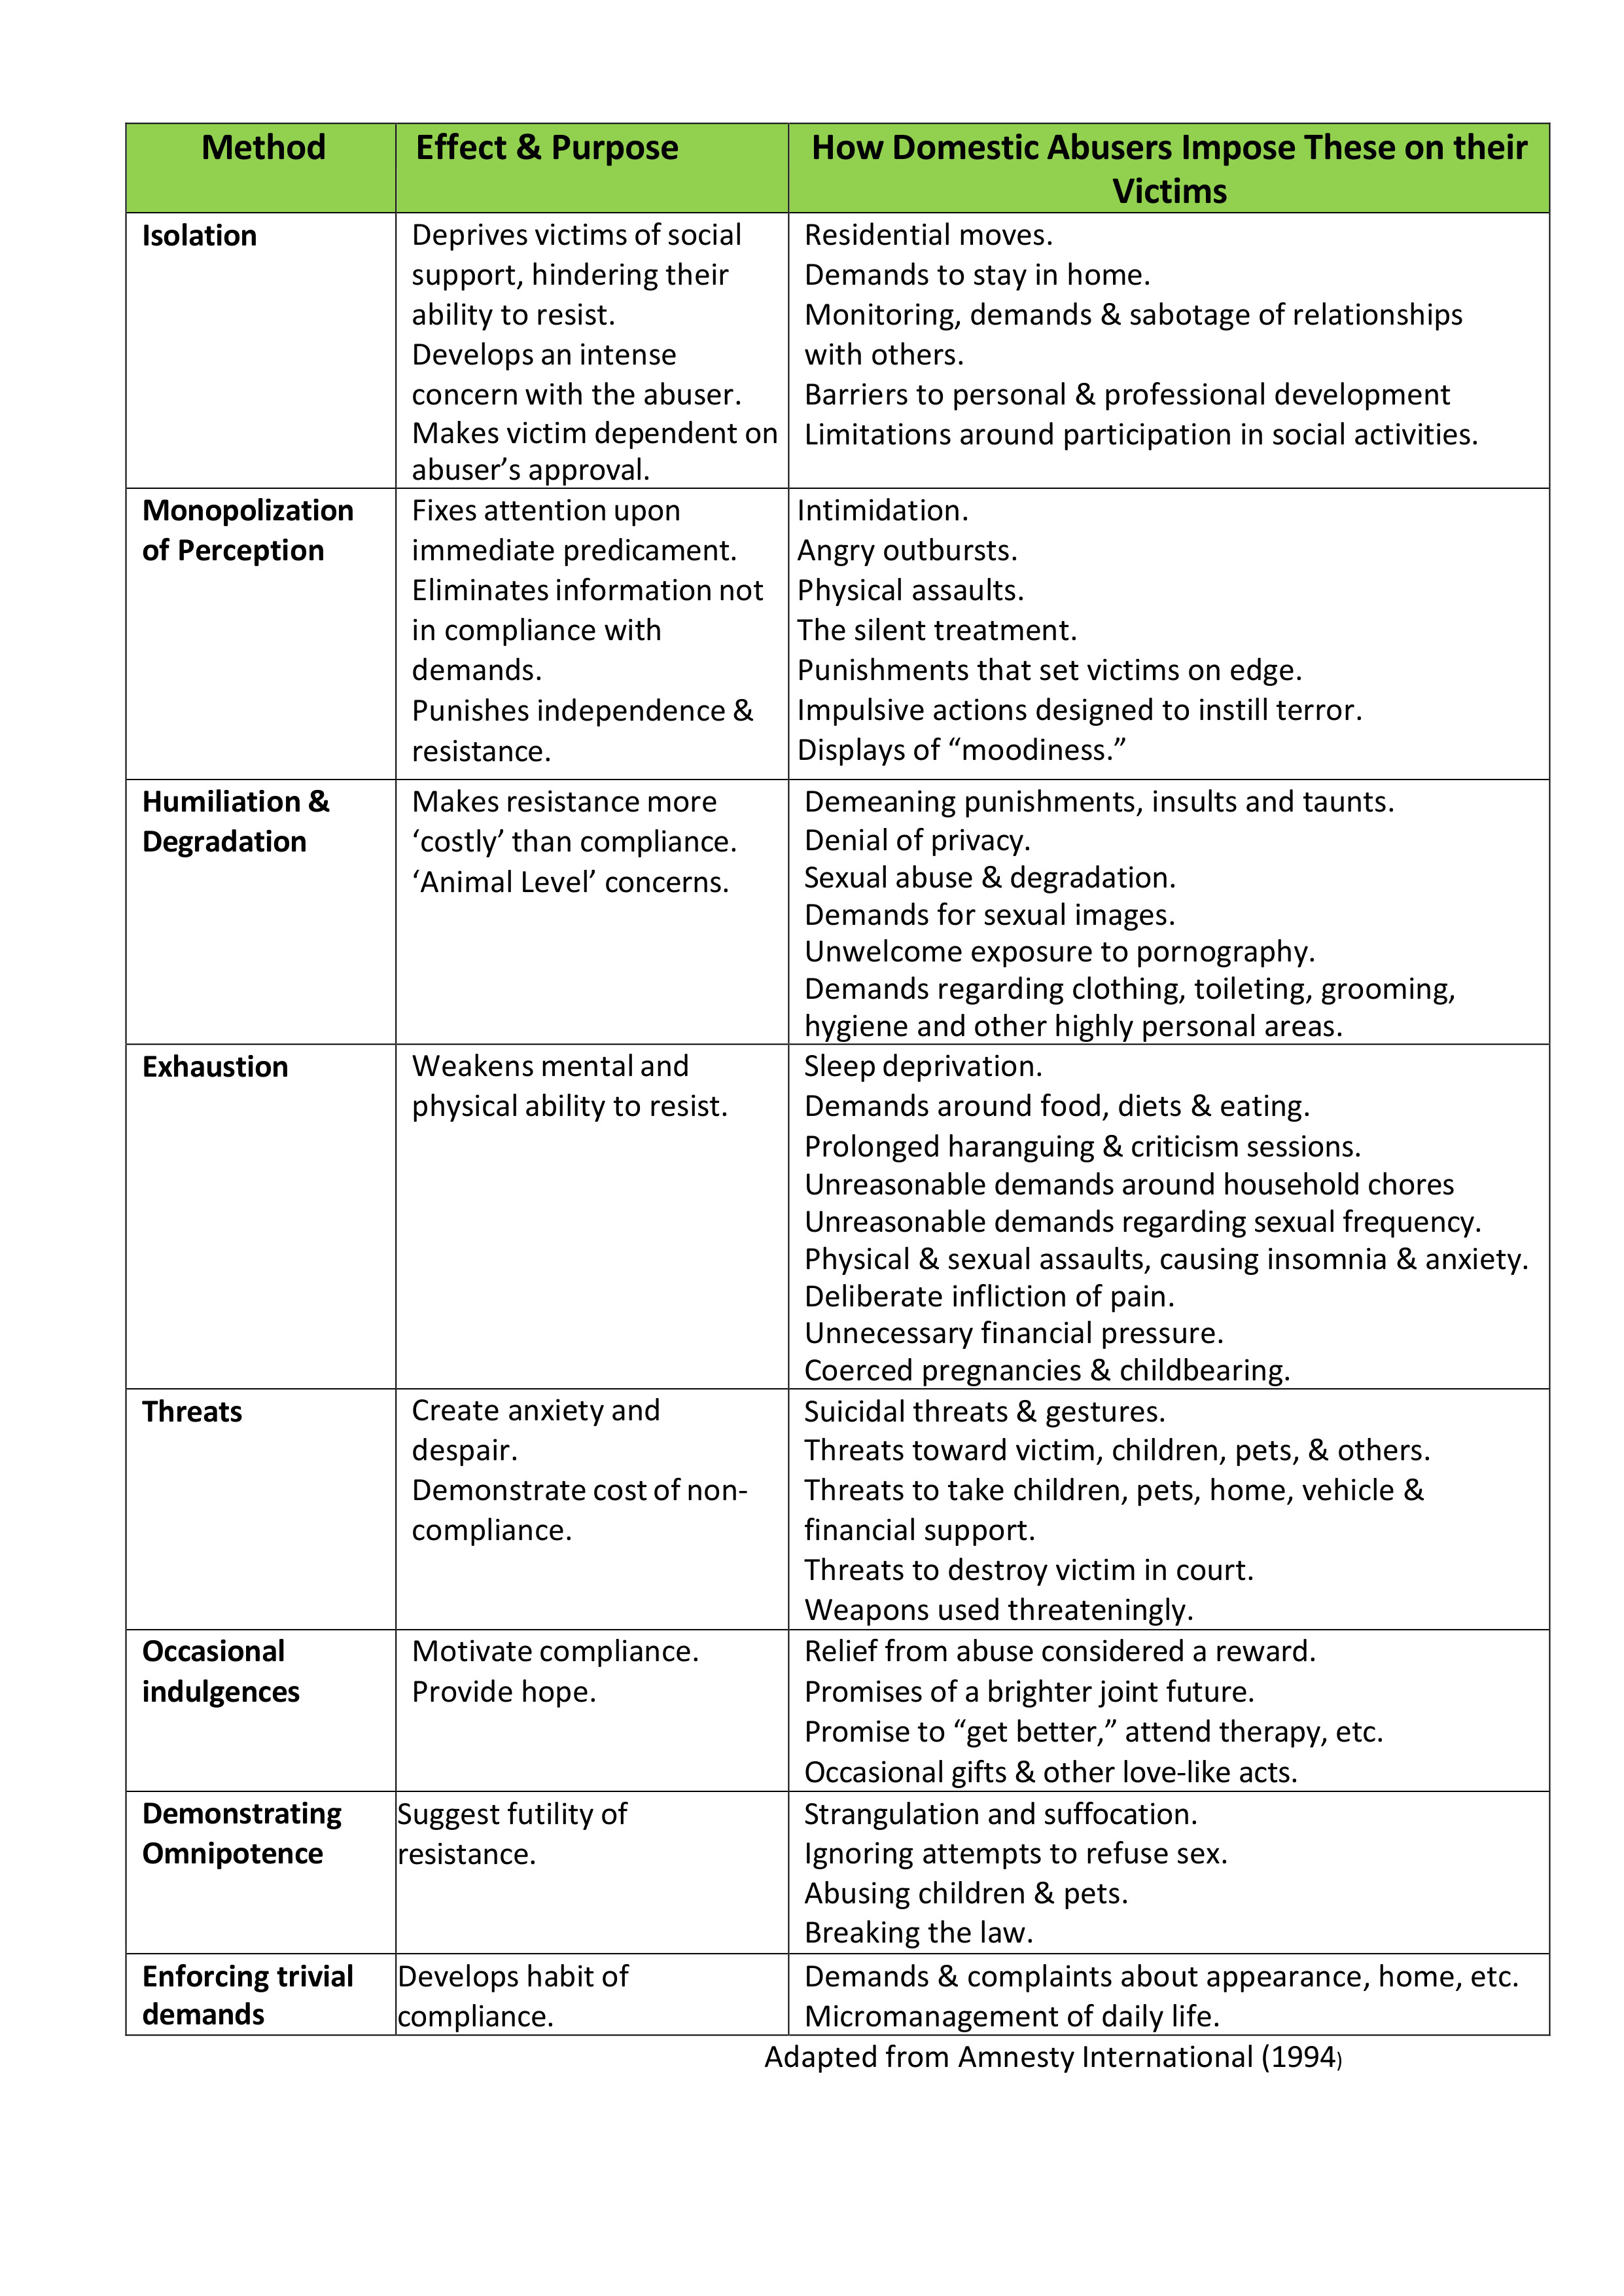
Bidermans Chart of Coercion Applied to Domestic Violence
Learn how abusers use coercive control to shape their targets’ behavior
- Apr 20, 2026
In 1957, sociologist Albert Biderman described the tactics torturers use to weaken and terrify prisoners of war. Ann Jones, Susan Schechter, and Evan Stark transferred these ideas to the field of domestic violence. they called this strategy coercive control.
Coercive control isn’t a single act; it’s a behavioral pattern designed to dominate an intimate. It can show up as isolation that shrinks a survivor’s world, degradation that erodes their sense of self or relentless micromanagement that turns daily life into a minefield. It may include manipulation, stalking, physical or sexual violence, threats or calculated punishment—but it doesn’t have to include all of these to be effective. Many abusers control their partners without hitting them.
For survivors, naming this pattern can be clarifying, even liberating. Naming and understanding the tactics connects the dots and relieves confusion. For advocates and professionals, the framework of coercive control brings the full picture into focus. It reminds us to look beyond visible injuries or discrete incidents to the ongoing system of control that shapes a survivor’s reality. Without this lens, we risk overlooking the very tactics that keep someone trapped.
In the chart below, Biderman’s Chart of Coercion is adapted to the tactics of domestic abusers. This chart illustrates how abusers entrap domestic violence victims. It can be used across mental health, advocacy, educational and legal settings.
Related topics for you


Video
Somatic Tools for Crisis Response with Iona Singleton


Article
The Link Between Domestic Violence and Suicide: What We Know and What We Don't

Article
Healthy Relationships: Dating After Domestic Violence

Article
Practical Ways to Feel Less Overwhelmed

Article